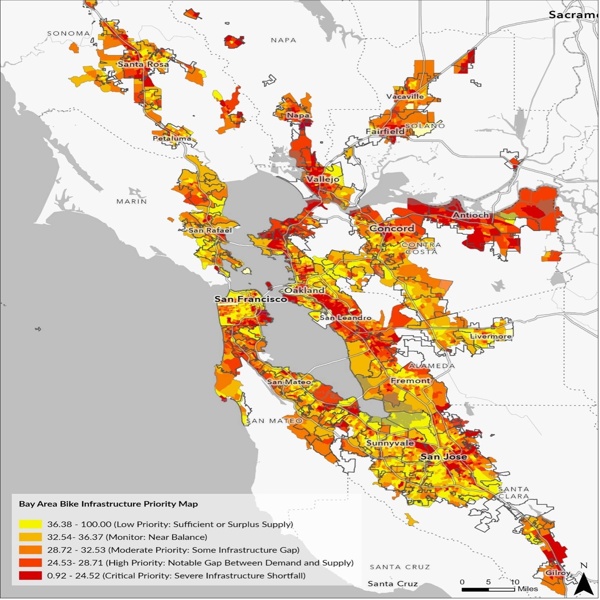
This interactive map visualizes the Bike Infrastructure Gap Index across the Bay Area's
nine counties, using 40+ spatial and demographic indicators to identify where cycling
investment is most needed. Developed by SJSU researchers, it supports planners and
policymakers in making equitable, data-driven decisions to advance multimodal mobility
for underserved communities.
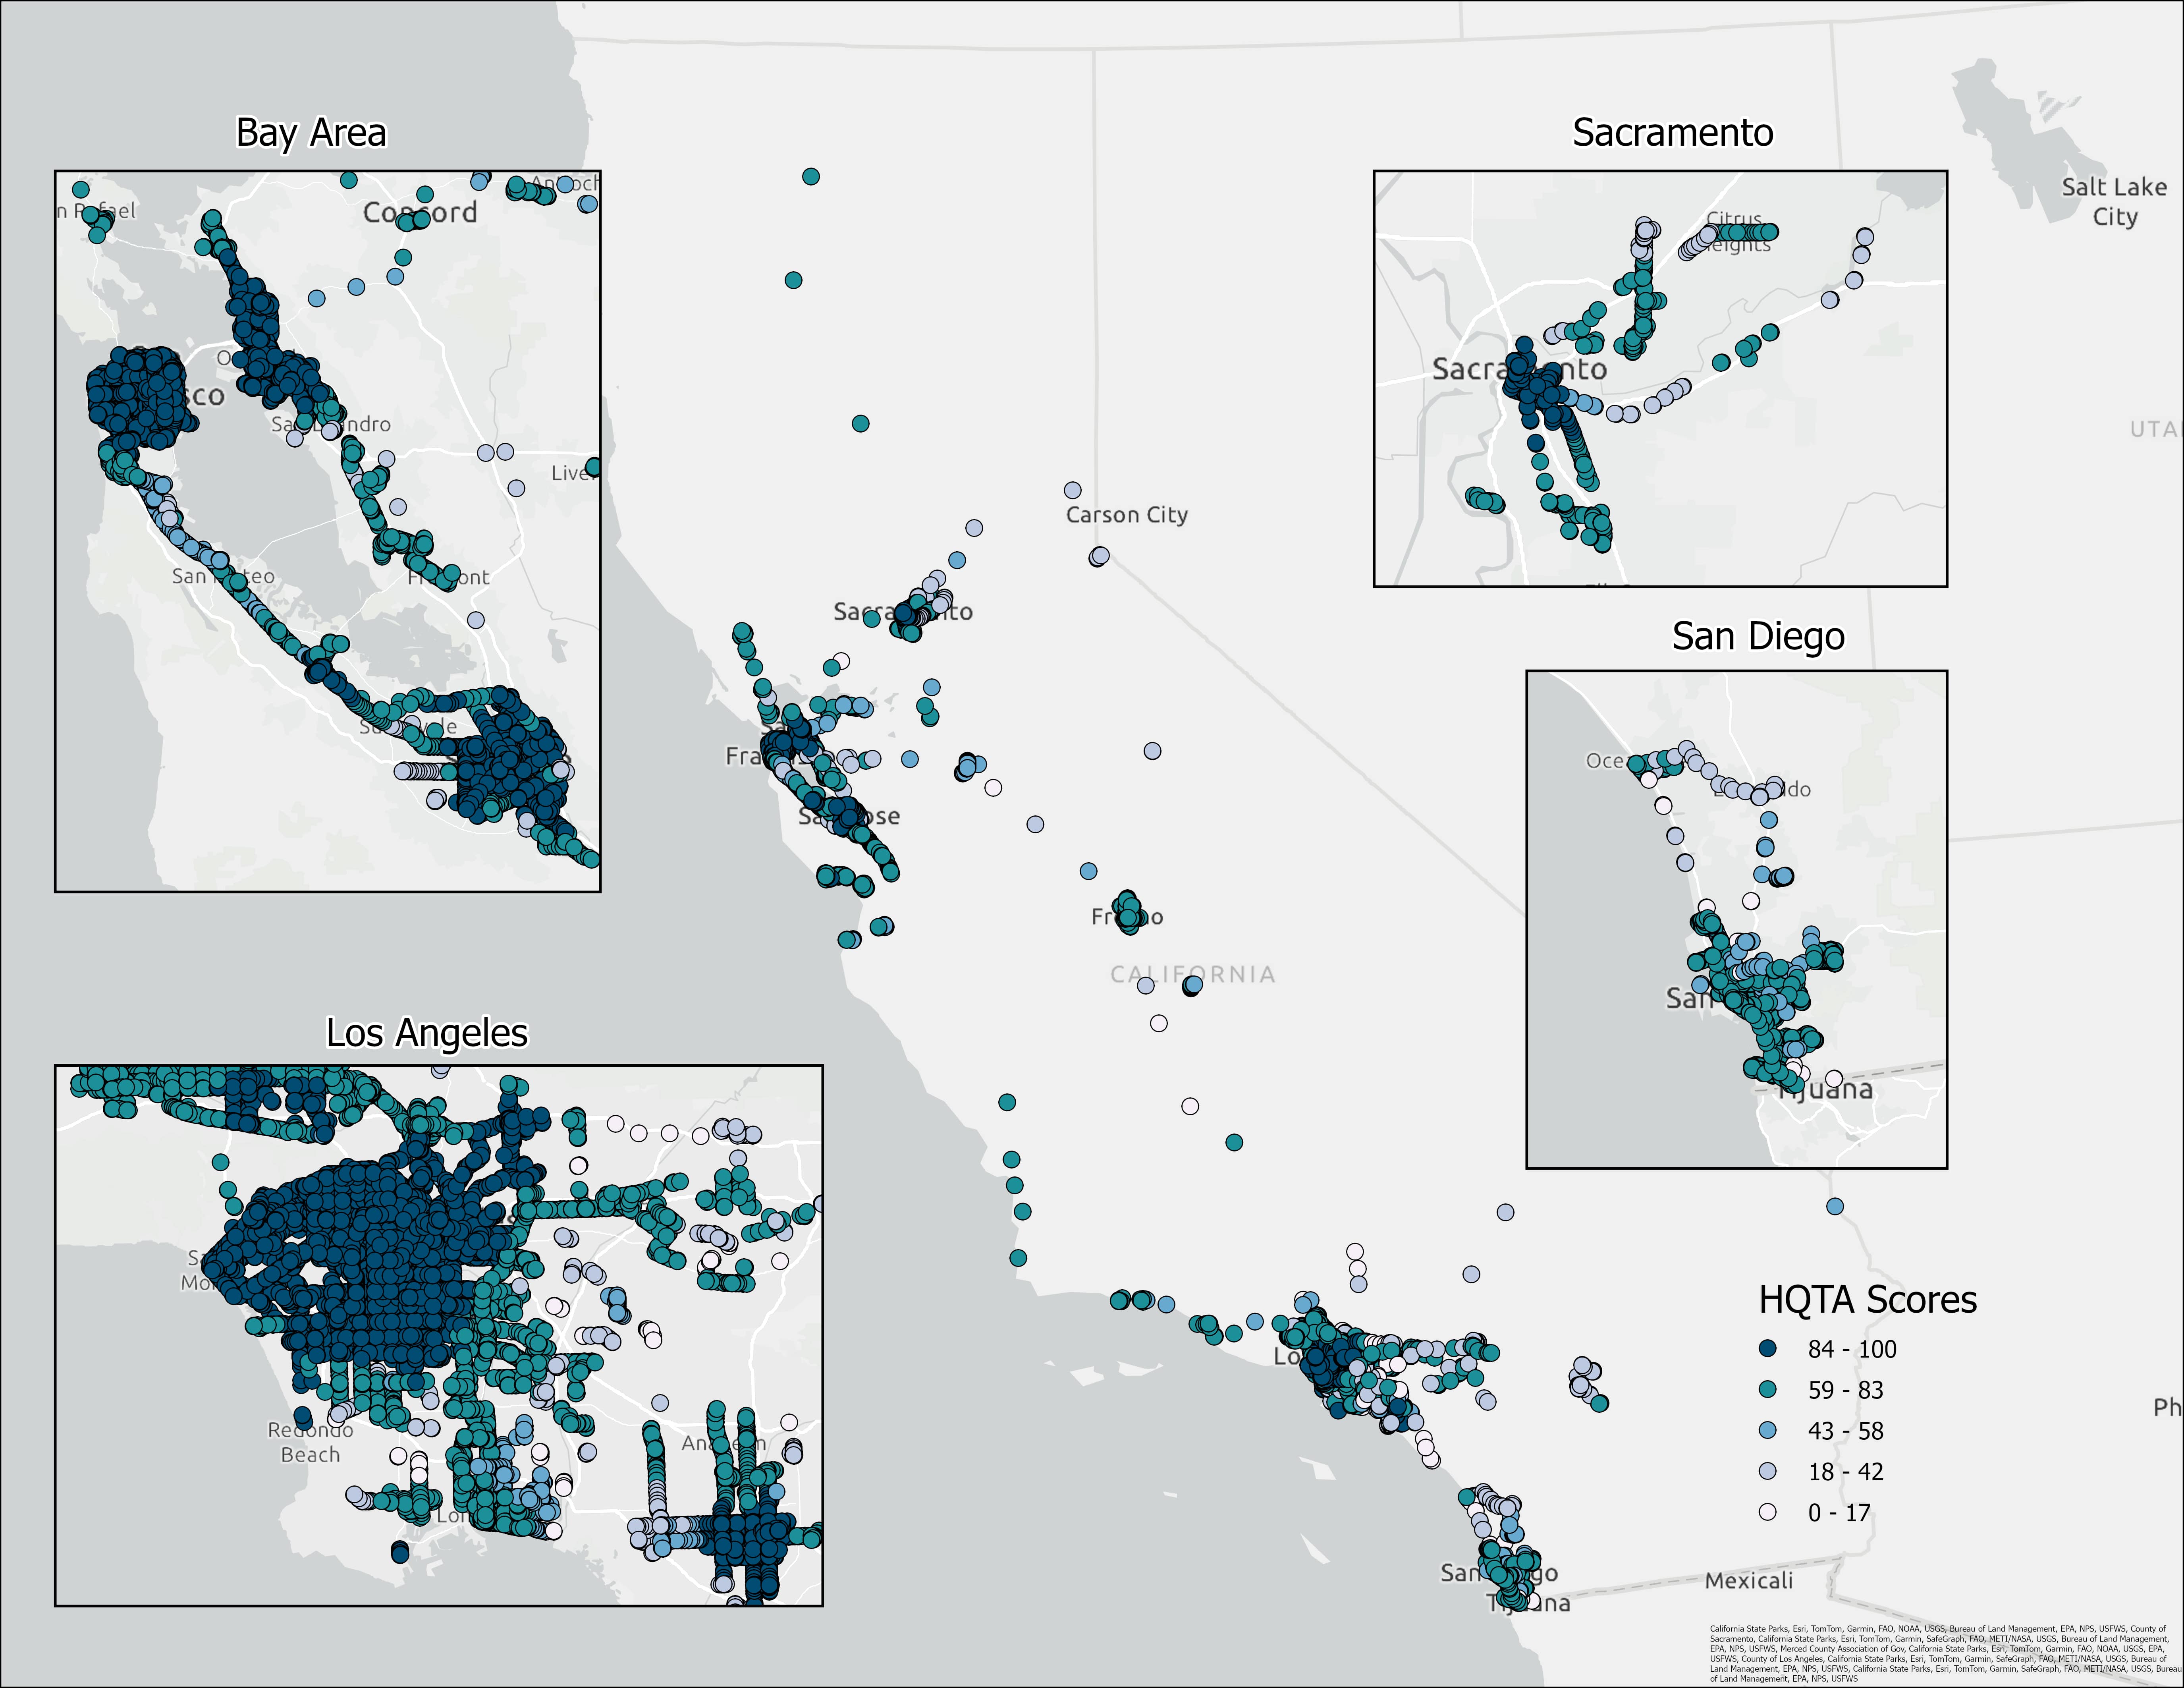
This interactive map scores over 66,000 transit station areas across California on
affordability, built environment, and racial equity. Using a 0–100 index, it helps
planners and policymakers identify where transit-oriented development is succeeding—and
where investment is most needed to advance housing affordability and transportation
justice.
This interactive map visualizes the location and sectoral typology of high-tech clusters
across 52 large U.S. metropolitan regions. Using firm-level data and spatial statistics,
it identifies 627 micro-scale tech zones classified by industry specialization — from
professional services to R&D — helping planners target innovation-driven economic
development strategies.
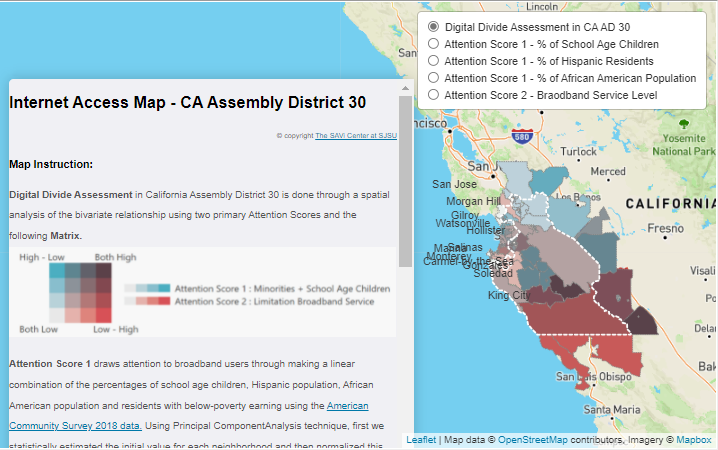
This interactive map visualizes broadband access disparities across California's 30th
Assembly District, classifying census blocks as well-served, served, or unserved based
on provider availability and download speeds. Overlaid with demographic and socioeconomic
data, it reveals how low-income communities and students of color bear the greatest
burden of digital inequity.
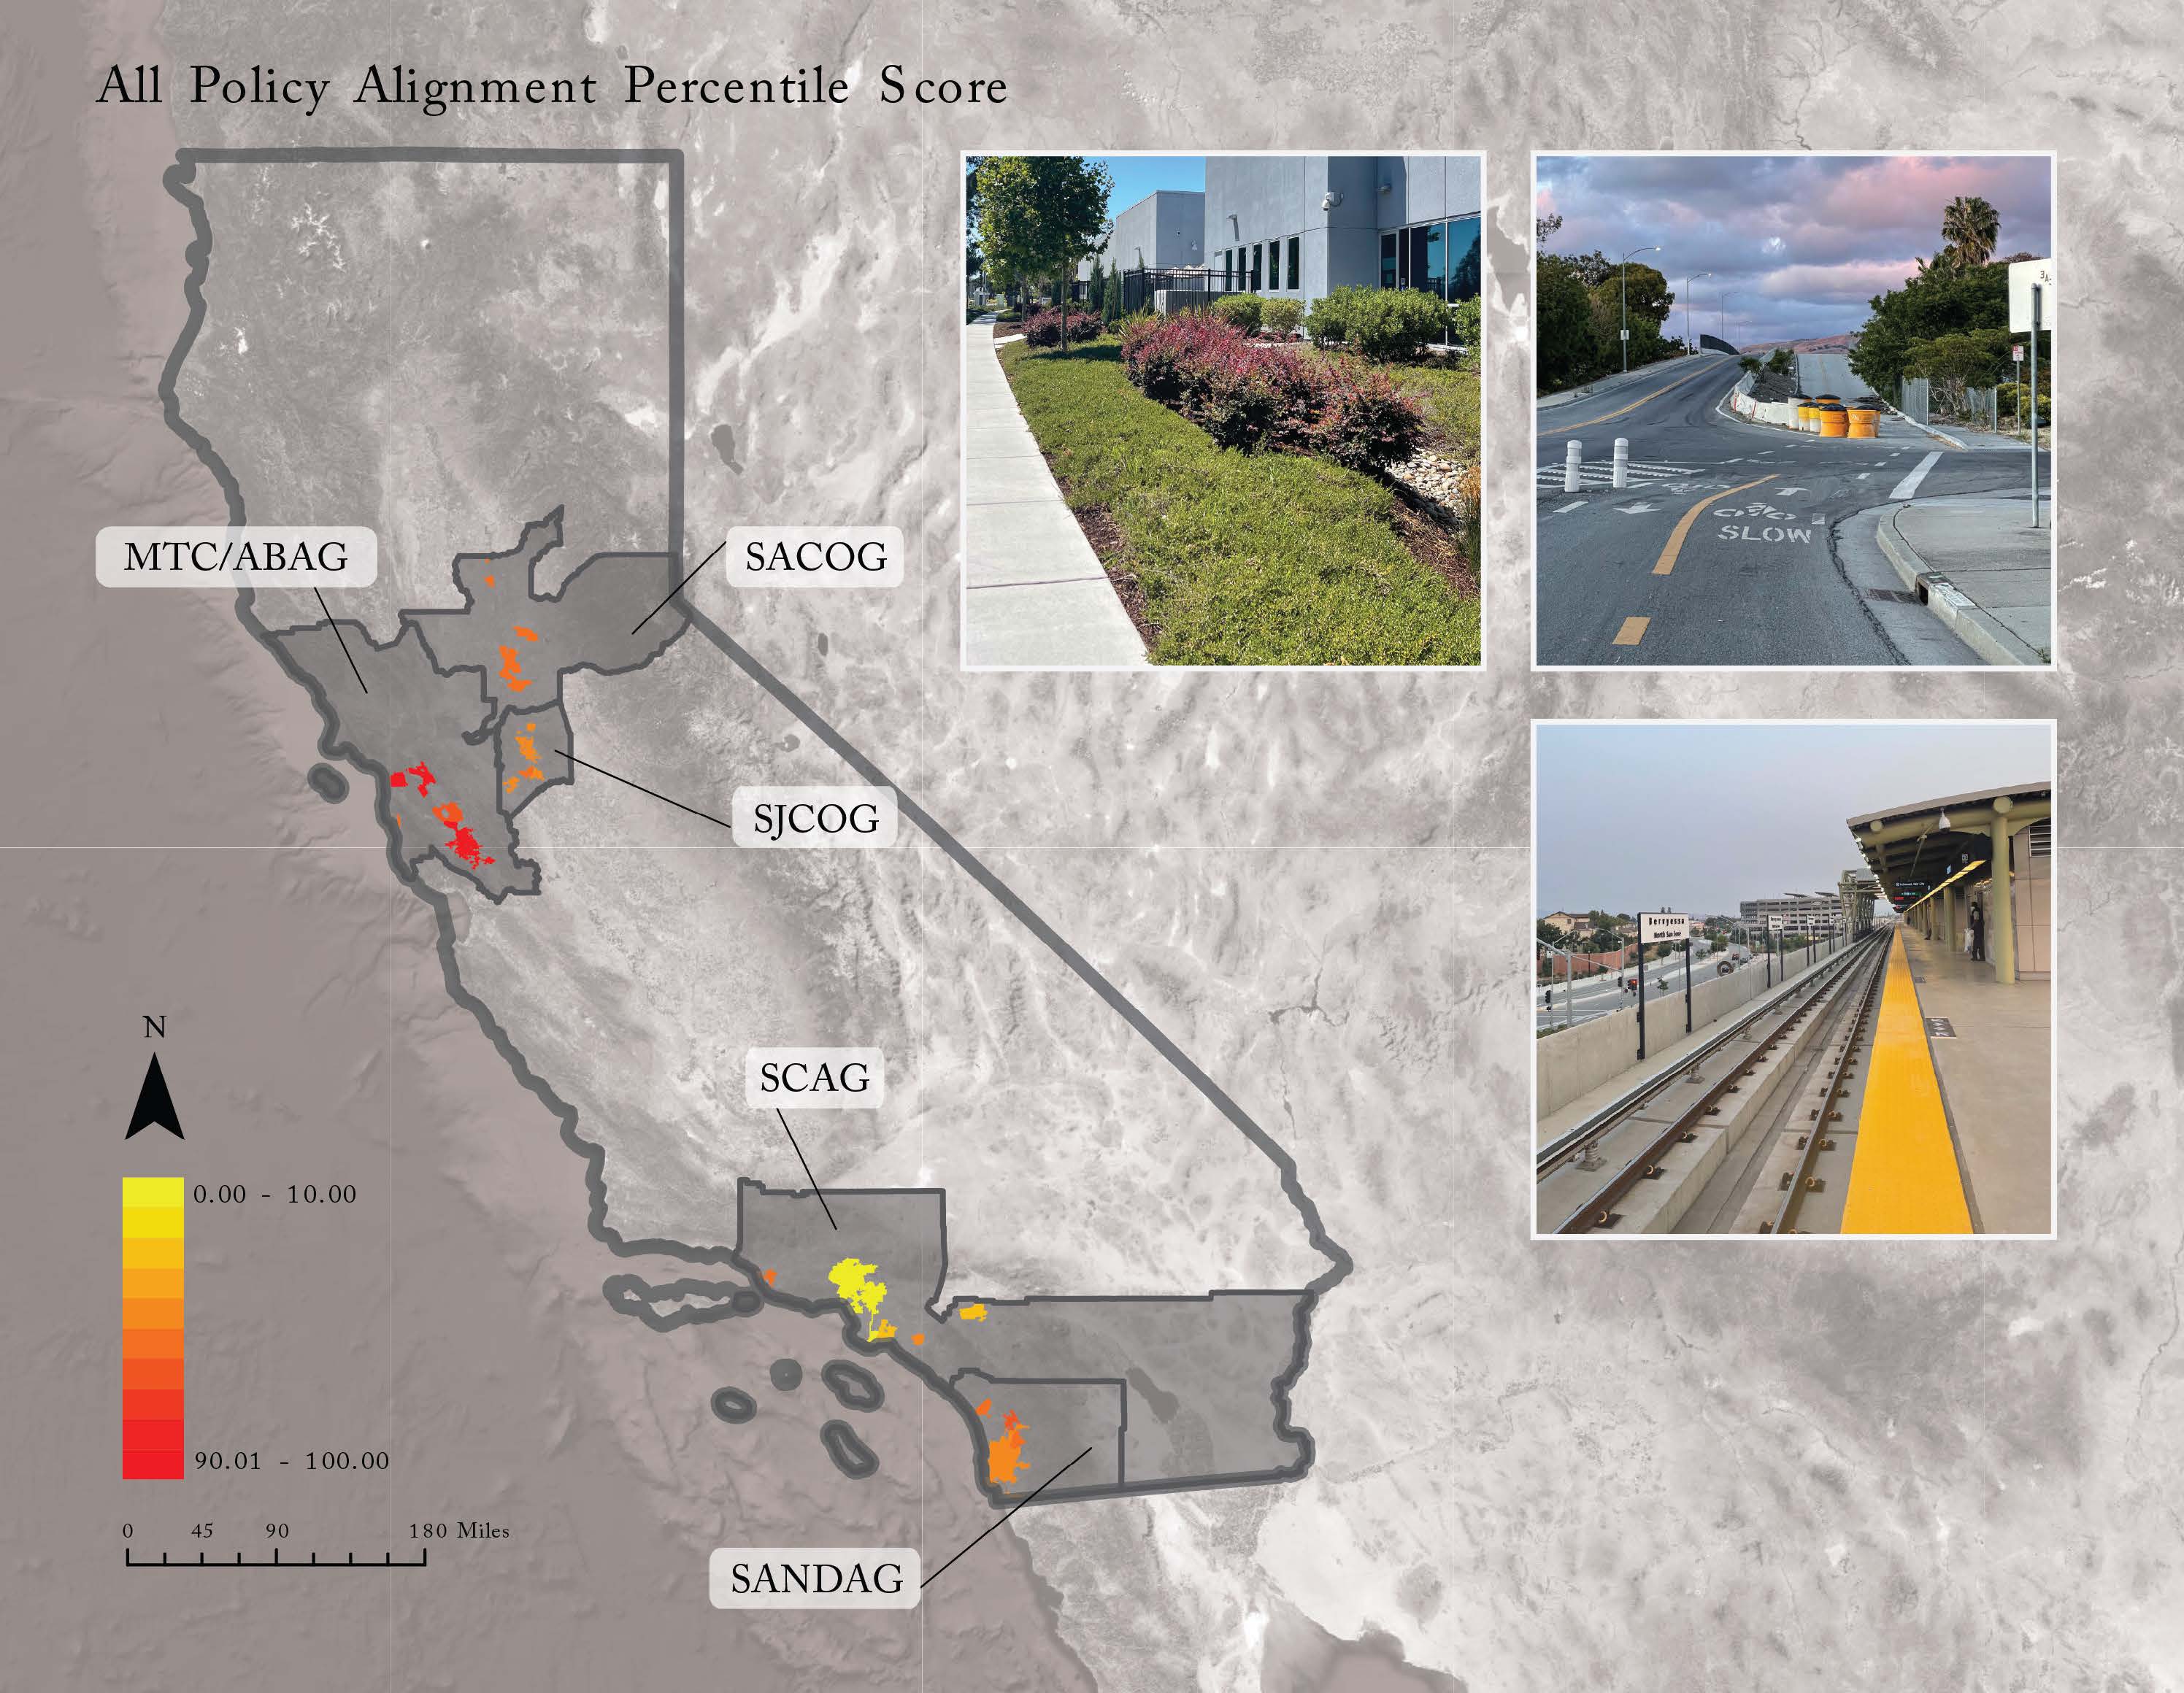
This interactive map displays Climate Policy Alignment Scores for 25 California cities
across five MPO regions, measuring how well local Climate Action Plans align with
regional Sustainable Communities Strategies under SB 375. Scores span transportation,
land use, TDM, and cross-cutting strategies to identify where coordinated climate
action is strongest.
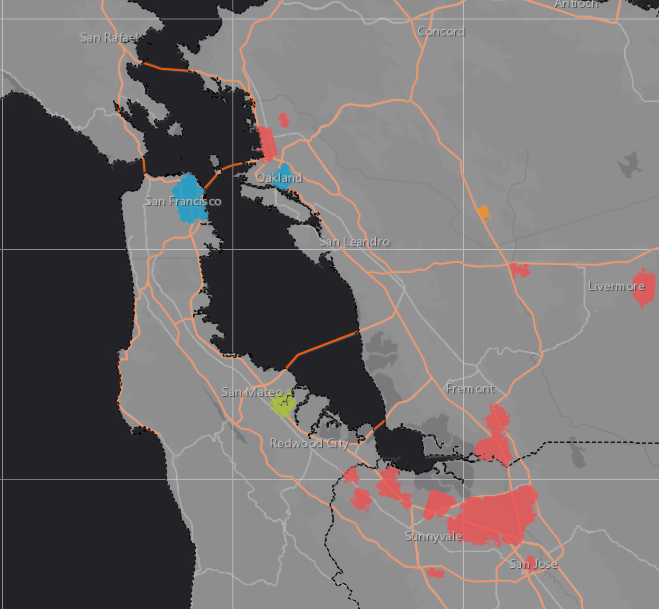
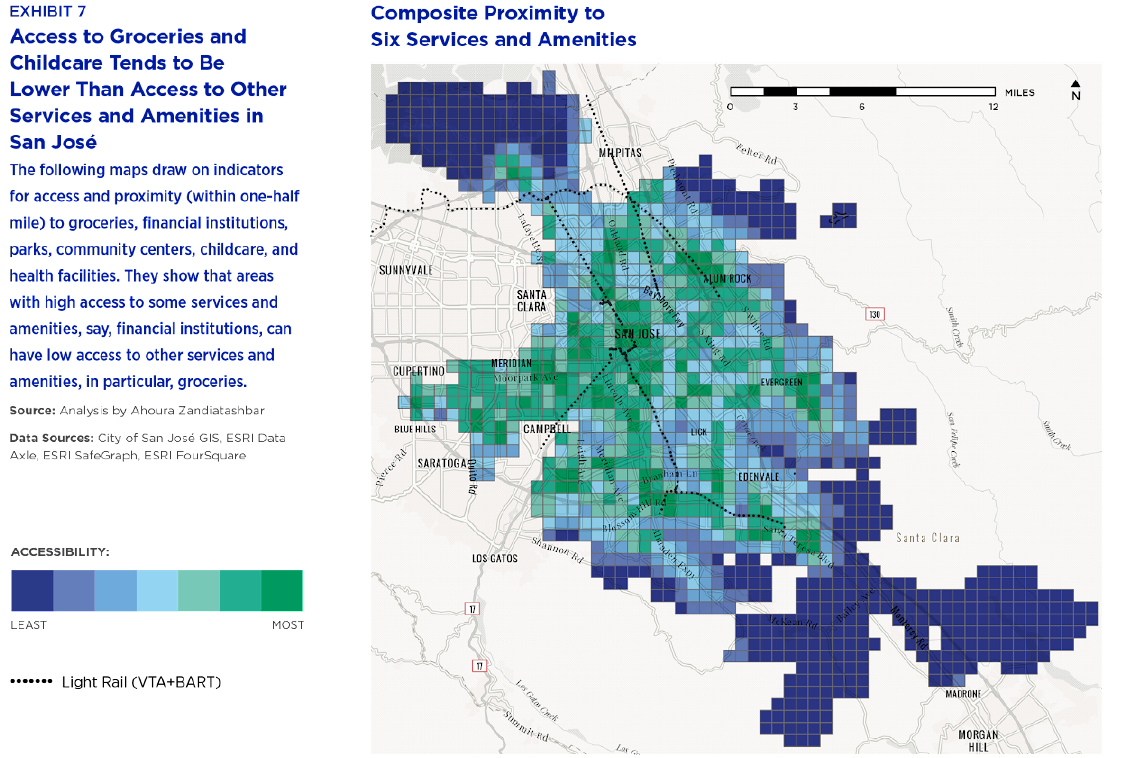
As part of SPUR's 15-minute city projects, SAVI measured and mapped access and proximity
(within one-half mile) to groceries, financial institutions, parks, community centers,
childcare, and health facilities. They show that areas with high access to some services
and amenities, say, financial institutions, can have low access to other services
and amenities, in particular, groceries.